
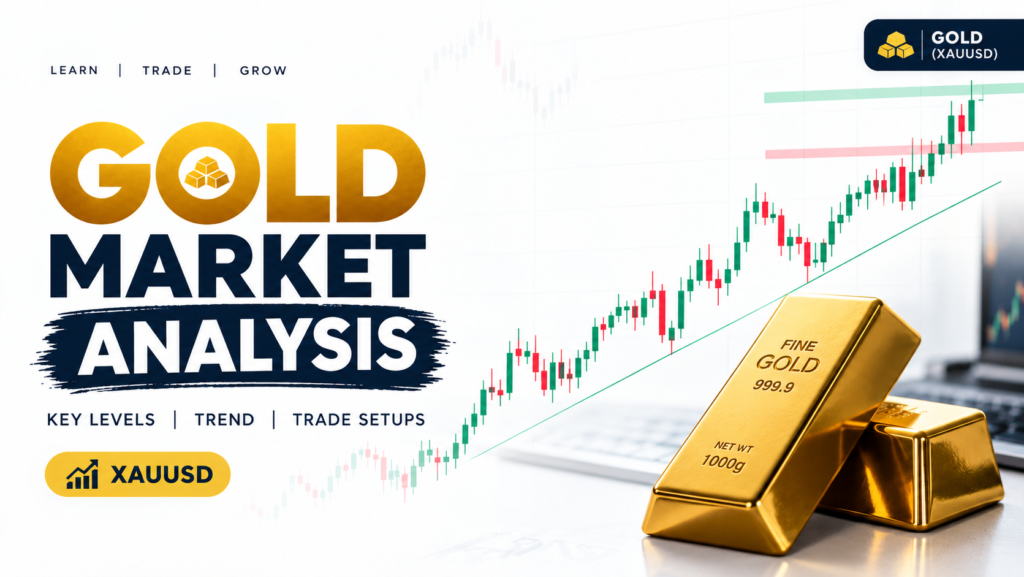
Gold is one of those markets where everyone has a theory. The dollar fell, so gold rose. The Fed sounded nervous, so gold rose. There’s a war somewhere, so obviously gold rose. Sometimes that’s true. Other times gold does the exact opposite and the same people explain that too, just as confidently.
I’m not saying the theories are useless. I’m saying a decent gold market analysis starts by admitting that several things push on price at once, and their weight changes from month to month.
Start with rates, because they usually win
If you only have time to track one thing, track interest rates, or more precisely what the market expects rates to do. Gold pays you nothing for holding it. When a government bond pays 4% or 5%, that’s a real cost of owning gold instead. When rates are heading down, the cost shrinks and gold looks better.
Here’s the part newer traders miss. Markets move on expectations, not announcements. By the time the Fed actually cuts, much of the move may already be in the price. That’s why gold sometimes drops on a rate cut day. It was priced in weeks ago.
Real yields (bond yield minus inflation) are the sharper version of the same idea. Gold and real yields tend to move in opposite directions, and that link has held up better than the popular “gold beats inflation” line. Inflation can be high and gold can still struggle if real yields are climbing.
The dollar, and why you shouldn’t trust it blindly
Gold is quoted in US dollars, so a stronger dollar makes it pricier for everyone else, and demand can cool off. Put the Dollar Index on a second screen and you’ll see the inverse pattern most days.
Most days. Not all. There have been stretches where both rose together, usually when fear was the main story. So use the dollar as a clue, not a rule.
Fear is a real driver, but a short one
When something scary happens, money goes looking for a safe place and gold is on the shortlist. Think banking stress, sudden conflict, a political shock. These moves can be violent and fast.
They also fade. A lot of traders get hurt by buying the headline an hour late. And here’s one that surprises people: in March 2020, when panic hit, gold actually sold off for a bit because investors needed cash and sold whatever they could. The big rally to its August 2020 high came afterwards.
Who’s actually buying
Central banks have been steady buyers for several years, especially in emerging economies that want to hold less of their reserves in dollars. That kind of buying isn’t speculative, and it tends to put a floor under dips.
Then there’s jewellery. India and China take a big share of physical demand, and anyone who lives in India knows how gold shopping spikes around Diwali, Dhanteras and wedding season. Local demand won’t set the global price, but it can soften a fall.
What the chart can tell you
Fundamentals explain the why. The chart tells you where to act, and I’d keep it boring.
Begin with the weekly and daily charts and mark the zones where price has turned around more than once. A level that has been tested five times matters. A line you drew off one candle doesn’t. Next, check whether price sits above or below the 50-day and 200-day moving averages. If it’s under both, I’d think twice before buying every dip.
RSI and MACD can help you spot a move that’s getting tired, but I treat them as a second opinion. A clear rejection candle at a level you’ve already marked tells me more than any indicator.
One more thing. If you’ve got seven indicators on screen and they disagree, that isn’t extra information. It’s noise. Delete a few.
A simple routine
Before you trade gold, spend ten minutes on this:
- Look at the economic calendar. Fed speakers, US inflation, jobs data.
- Check the dollar and Treasury yields.
- Mark your zones on the daily and 4-hour charts.
- Only look for trades that agree with the bigger trend.
- Set your stop and size before you enter. Not after.
Step five is where most accounts get saved or wrecked.
Where beginners go wrong
The most common mistake is trading right into a data release. Gold can move a few hundred pips in minutes, spreads widen, and stops get filled far from where you placed them. That’s gambling with extra costs.
The second is leverage. Gold is more volatile than people expect, and a normal pullback can turn into a margin call if you’re oversized.
The third is mixing timeframes. A long-term holder and a day trader are playing different games. Someone who bought gold as a multi-year hedge shouldn’t panic over a one-day dip, and a scalper shouldn’t hold a losing trade because “gold is a long-term asset.” Remember 1980? Gold peaked near $850 and took roughly three decades to get back above it. Long-term doesn’t always mean soon.
So what’s the takeaway?
Nobody nails tops and bottoms, and you don’t need to. Figure out which forces are loudest right now, mark your levels, keep risk small, and be patient. Gold rewards people who wait for their price.
Disclaimer: This article is for educational purposes only and isn’t financial advice. Trading gold and other leveraged products carries a high level of risk.